
Executive Summary
The economics of rooftop solar installation in New Zealand are strongly positive — a conservative analysis of a typical 5 kW system shows a 9 year payback time, and even a household self-consuming only a quarter of its output still sees a positive NPV (~+$2k over the 25 year estimated system lifespan). Batteries are a different story: at today's prices the financial case does not stand on its own, and current installations are driven more by resilience considerations than by returns. While behind-the-meter batteries do benefit the wider electricity system — reducing peak demand and deferring network upgrades — in New Zealand in 2026 their whole-of-system benefit still falls short of their total cost.
This is not the case in Australia. Massive solar uptake has carved a deep demand "duck curve" — negative midday prices and severe network constraints — and governments there now subsidise home batteries to alleviate exactly these issues, through several state schemes and, since July 2025, the A$2.3 billion federal Cheaper Home Batteries rebate.
Drawing on our companion report on what those batteries have done to the Australian grid ("Have Home Batteries Affected Australia's Demand Curve?": 343,000 registrations in ten months, visibly arresting a decade of midday demand erosion), this report examines whether — and when — such a policy would be worth pursuing in New Zealand: how deep our duck curve must become before a home battery creates more value than it costs, and when the solar build-out gets us there.
- Rooftop solar needs no subsidy: a 5 kW system pays back in ~9 years (+$5.2k NPV at 6% real). Its owners already capture ~25 c/kWh — roughly double the ~12 c/kWh wholesale value of midday energy.
- A 10 kWh home battery is privately NPV-negative (~$766/yr savings vs ~$1,236/yr annualised cost; NPV −$4.6k) and remains marginally NPV-negative (−$1.2k) even counting quantifiable whole-system value — because New Zealand has essentially no duck curve yet: midday and evening prices differ by only ~$14/MWh on average, which round-trip losses almost exactly consume (net ~$1/MWh).
- The gap is a wholesale-timing shortfall of ~$126/yr, equal to an effective spread of ~$50/MWh. On the Australian relationship between rooftop penetration and spread, that spread appears at a penetration ratio of ~0.42 (installed solar MW ÷ average demand MW). New Zealand is at 0.22 today.
- An optimistic solar trajectory reaches the threshold around 2028–2030 — organic growth at the current 49%/yr pace and an Australia-pace adoption path arrive at almost the same time. The 2.3 GW of consented utility-scale solar would pull this earlier.
- Falling battery prices shortcut the whole calculation: whole-system break-even needs only ~$1,080/kWh installed against ~$1,200/kWh today. Whichever arrives first — the duck curve or the cost decline — the subsidy conversation should start before it does, not after.
The Economics Today: Solar Pays, Batteries Don't (Privately)
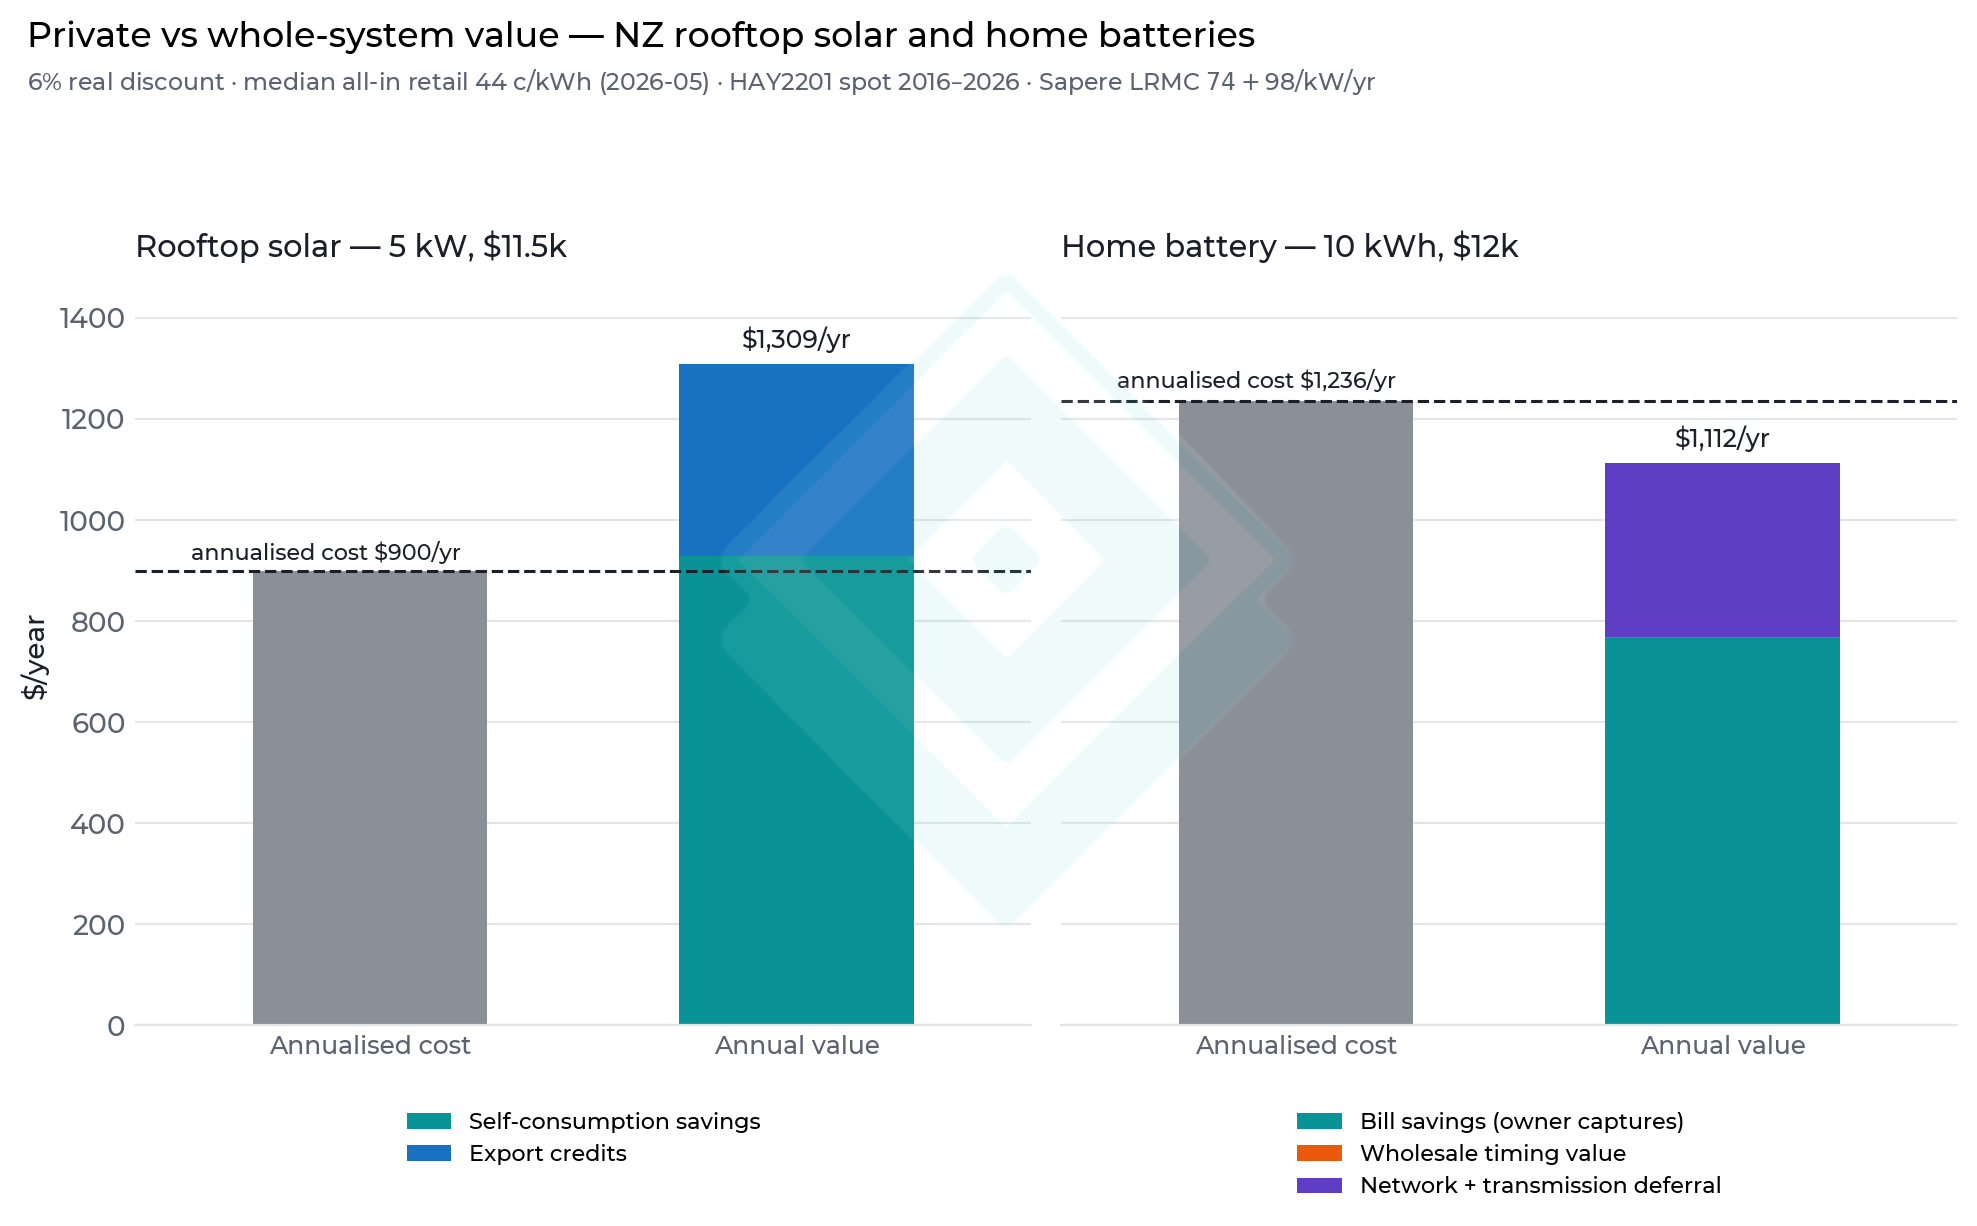
A 5 kW rooftop solar system at ~$11.5k generates about 5,281 kWh/yr (adjusted-irradiance basis, main centres). At the median all-in retail rate of 44 c/kWh (2026 Q2) with 40% self-consumption and a 12 c buy-back, that is worth ~$1,309/yr — a 9-year payback and +$5.2k NPV over 25 years at a 6% real discount rate. Subsidising it pays people to do something already profitable, and every added panel deepens the midday trough that storage must later be paid to fill.
A 10 kWh battery at ~$12k saves its owner ~$766/yr shifting ~2,500 kWh of solar surplus into evening self-supply: a 16-year payback against a ~15-year life, NPV −$4.6k. This is why uptake is minimal.
The battery's case improves — but does not yet close — when system value is counted. Discharging ~2 kW into the evening peak defers distribution and transmission investment worth ~$344/yr (Sapere's DER cost-benefit analysis for the Electricity Authority: $74 + $98 per kW-year). But the third leg, wholesale timing value, is worth almost nothing today: over 2016–2026 the Haywards midday price averaged $121 and the evening price $135/MWh — a raw spread of just ~$14/MWh, which round-trip losses almost exactly consume, leaving ~$1/MWh of net value per stored unit (~$2/yr; winter is the partial exception at ~$25/MWh raw). Total quantifiable value ~$1,112/yr against an annualised cost of ~$1,236/yr: still short. Reserves capability, outage resilience and fleet-scale dry-year insurance (hydro holding water while solar charges the evening) sit on top, unquantified.
How Big a Duck Curve Do We Need?
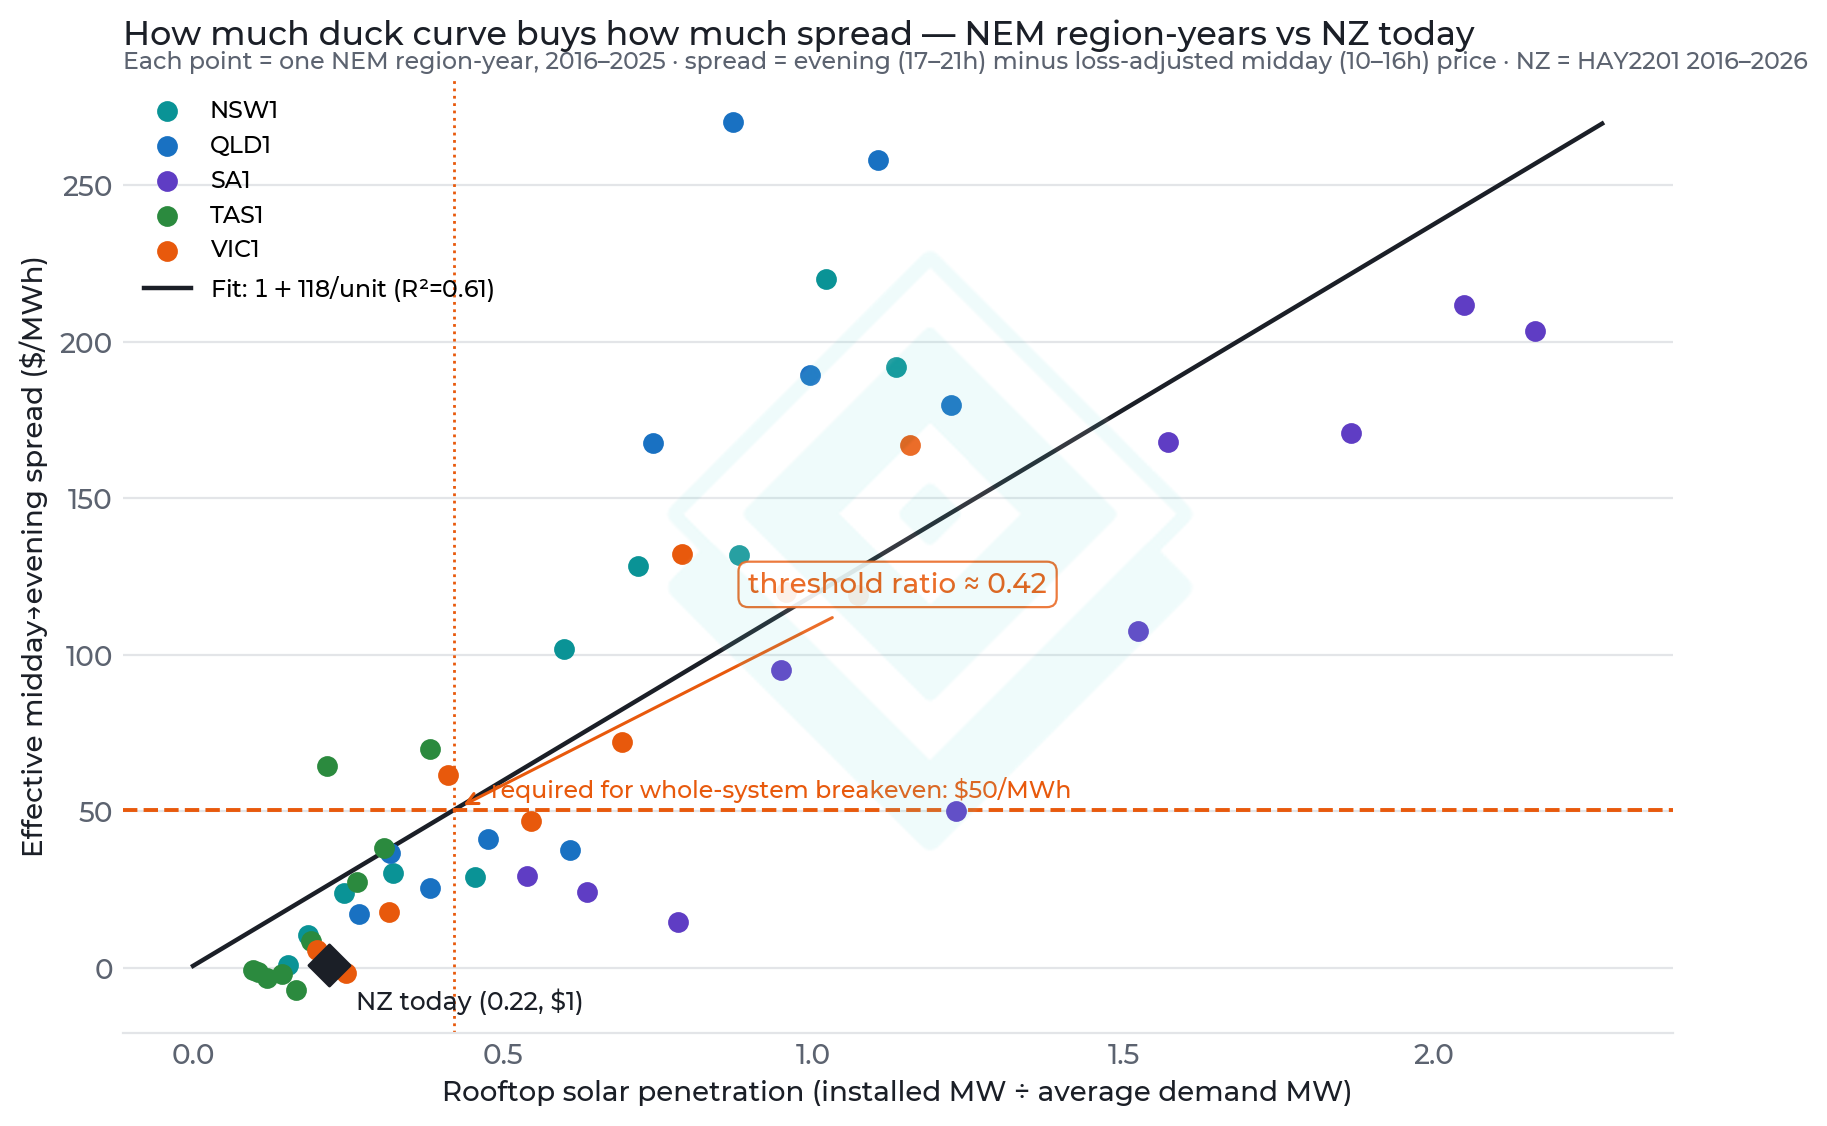
The arithmetic of the shortfall: closing the remaining ~$126/yr gap on ~2.5 MWh of annual discharge requires an effective midday→evening spread of ~$50/MWh (evening price minus loss-adjusted midday price), holding today's battery cost, bill savings and network value fixed. New Zealand today: ~$14/MWh raw, ~$1/MWh after losses.
How much solar does it take to open a $50 spread? Australia has run the experiment for us. Across the five NEM regions and every year since 2016 (50 region-years), the effective spread rises with rooftop penetration (installed rooftop MW ÷ average regional demand MW) at roughly $118/MWh per unit of penetration ratio (R² = 0.61). South Australia — penetration ratio 2.2, effective spread ~$203/MWh — is the deep end of the pool; the fitted relationship puts the $50/MWh threshold at a penetration ratio of ~0.42.
New Zealand's distributed solar (979 MW at 2026-05) against average demand of 4,478 MW puts us at 0.22 — about 52% of the way there.
One caution the chart makes visible: New Zealand's actual spread today (~$1/MWh) sits well below what the Australian relationship predicts at our penetration (~$26/MWh). Flexible hydro absorbs midday solar far more cheaply than the NEM's coal-and-gas fleet did, so the threshold ratio should be read as the early edge of a range — New Zealand may need to overshoot it before the spread follows.
When Does the Duck Arrive?
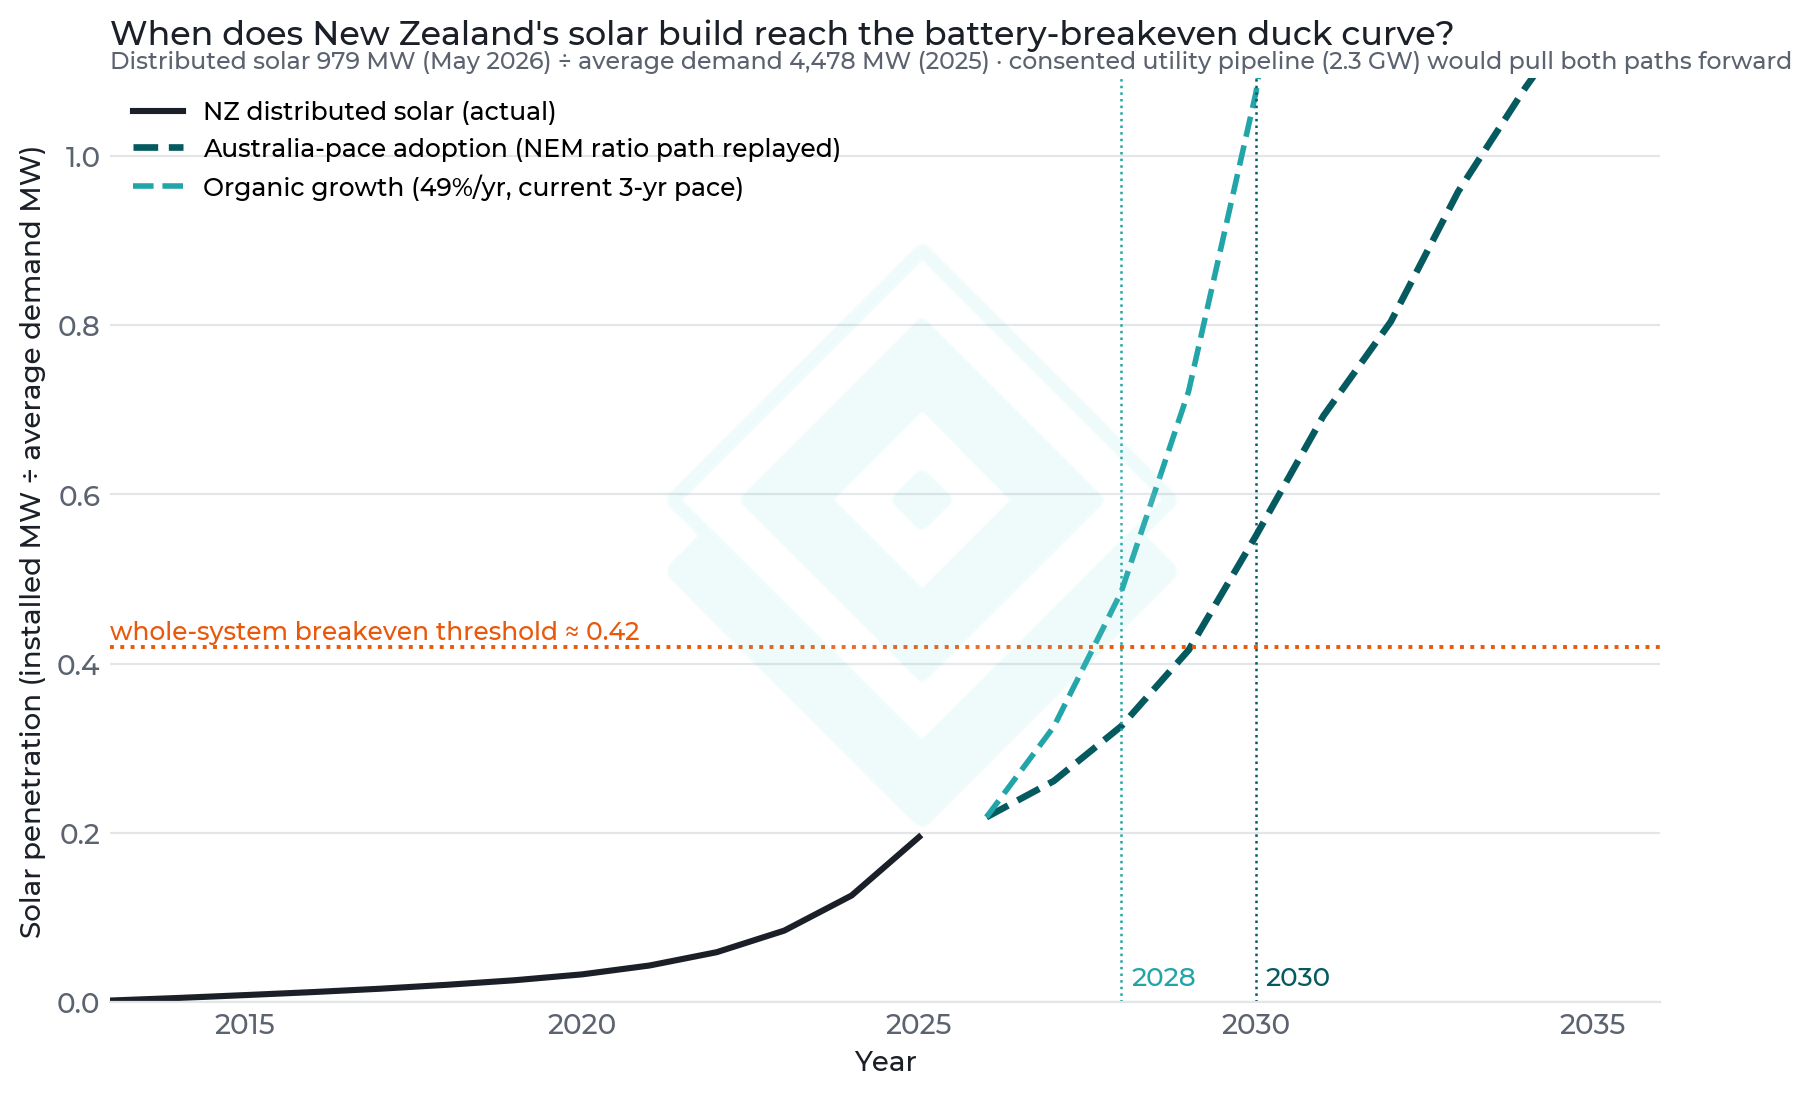
Two forward paths for New Zealand's penetration ratio. Organic: distributed solar keeps compounding at its current three-year pace (49%/yr) — it crosses the threshold in ~2028. Australia-pace: New Zealand's ratio follows the NEM-wide adoption path from the point where Australia stood at our current penetration — it crosses in ~2030. Two very different assumptions, nearly the same answer: the whole-system case for home batteries closes around 2028–2030 on wholesale timing alone.
Three things pull that date earlier. First, 2.3 GW of utility-scale solar is already consented (of a 10.9 GW pipeline) — grid-scale solar depresses midday prices just as rooftop does, and none of it is in our trajectory. Second, battery costs are falling: whole-system break-even needs ~$1,080/kWh against ~$1,200/kWh today, so a ~10% cost decline closes the gap with no duck curve at all. Third, winter spreads are already wider ($133 vs $158/MWh) and congested, winter-peaking networks carry deferral value well above the national-average LRMC used here.
The policy conclusion is about sequencing. Australia subsidised batteries after the duck curve made them obviously valuable — and paid launch-scale rebates (~A$330/kWh) roughly equal to the externality we compute for New Zealand (~$3.4k NPV per 10 kWh battery). New Zealand has the luxury of designing the scheme before the need peaks: a storage-targeted incentive that scales with the duck curve (or simply with time), rather than a solar subsidy that accelerates the problem it will later have to solve.
Methodology
- Battery economics: 10 kWh usable at $1,200/kWh installed (2026 market average), 90% round-trip efficiency, 250 equivalent full cycles/yr (solar-paired), 15-year life, 6% real discount rate. Private value = discharged energy at the median all-in retail rate (44 c/kWh incl. GST, MBIE regional quarterly survey, 43 towns, 2026 Q2) less charged energy at a 12 c/kWh buy-back.
- System value: network/transmission deferral at 2 kW coincident peak reduction × Sapere DER CBA LRMC for the Electricity Authority ($74/kW/yr distribution + $97.8/kW/yr transmission); wholesale timing = evening (17:00–20:59) minus loss-adjusted midday (10:00–15:59) price at the Haywards reference node HAY2201, rolling 10-year window 2016–2026 (v_electricity_prices_30min).
- Solar economics: 5 kW at $2,300/kWp; yield 1,124 kWh/kWp/yr from cloud-adjusted GHI (Auckland/Wellington/Christchurch, last five full years) at PR 0.80, tilt gain 1.10, 0.5%/yr degradation; 40% self-consumption; 25-year life.
- Required spread: the timing value needed for whole-system NPV = 0 at current capex (~$126/yr over 2,500 kWh discharged = $50/MWh effective spread, defined as P_evening − P_midday/RTE per discharged MWh).
- Australian calibration: AEMO 5-minute dispatch RRP and regional demand (nem_dispatch_prices), all days from 2016 through the last full year, AEST time bands matching the NZ definition; rooftop penetration = cumulative CER small-scale solar registrations (DC kW, from 2001) ÷ average regional demand; OLS fit across 50 region-years (partial current year excluded).
- NZ penetration: EMI installed distributed generation (Solar, national) ÷ average demand from metered grid imports (2025). Projections hold demand flat: organic path compounds installed MW at the 49%/yr three-year CAGR; Australia-pace path replays the NEM-wide year-on-year penetration increments starting from NZ's current ratio.
- Utility pipeline context: Transpower connection-pipeline projects with technology = Solar; consented = 'Consent Granted'.
Caveats
- The Australian spread-vs-penetration relationship is an empirical shorthand, not a causal isolation: NEM spreads also reflect utility-scale solar, gas prices (especially the 2022 crisis), interconnection and grid-battery buildout. It is used to size the effect, not to forecast prices.
- NZ's penetration ratio uses distributed solar only. The consented utility-scale pipeline would deepen the midday trough well beyond the distributed-only trajectory — our crossing years are conservative (late) on that count.
- The threshold holds battery capex, retail rates, buy-back rates and network LRMC at today's values. Falling capex moves the threshold down (a ~10% decline closes the gap outright); rising evening retail rates raise private value with the same effect.
- The EMI distributed-generation series includes some distribution-connected farm-scale solar; NZ's true rooftop-only ratio is slightly lower than shown, which again makes the crossing estimate conservative.
- The whole-system value excludes reserves revenue, outage resilience, distribution-loss savings and dry-year hydro-conservation value — all positive. Orchestration (VPPs, ToU tariffs) will privatise part of the system value over time, shrinking the required subsidy.
- Hydro-dominated NZ may never replicate the NEM's spread depth at equal penetration (hydro flexes against solar cheaply); equally, dry years and gas scarcity could widen spreads sooner. The Australian fit brackets rather than predicts.