
Executive Summary
New Zealand's wholesale electricity price is, to first order, a weather derivative. This analysis joins 1.7 million hourly observations — every grid exit point matched to its nearest weather station, 2022–2026 — and asks how the mean spot price moves across the distribution of four weather variables: hub-height wind speed, solar irradiance, precipitation and temperature.
All four matter, but not equally, and not on the same timescale. Over short timescales (hours to days), rain has very little correlation with price — rain in a given hour is almost uncorrelated with it. Accumulated over weeks, feeding the hydro lakes that supply over half of New Zealand's electricity, it dwarfs everything else. Wind and sunshine shave prices in the hour they occur; temperature works through demand and is the only variable with a U-shape.
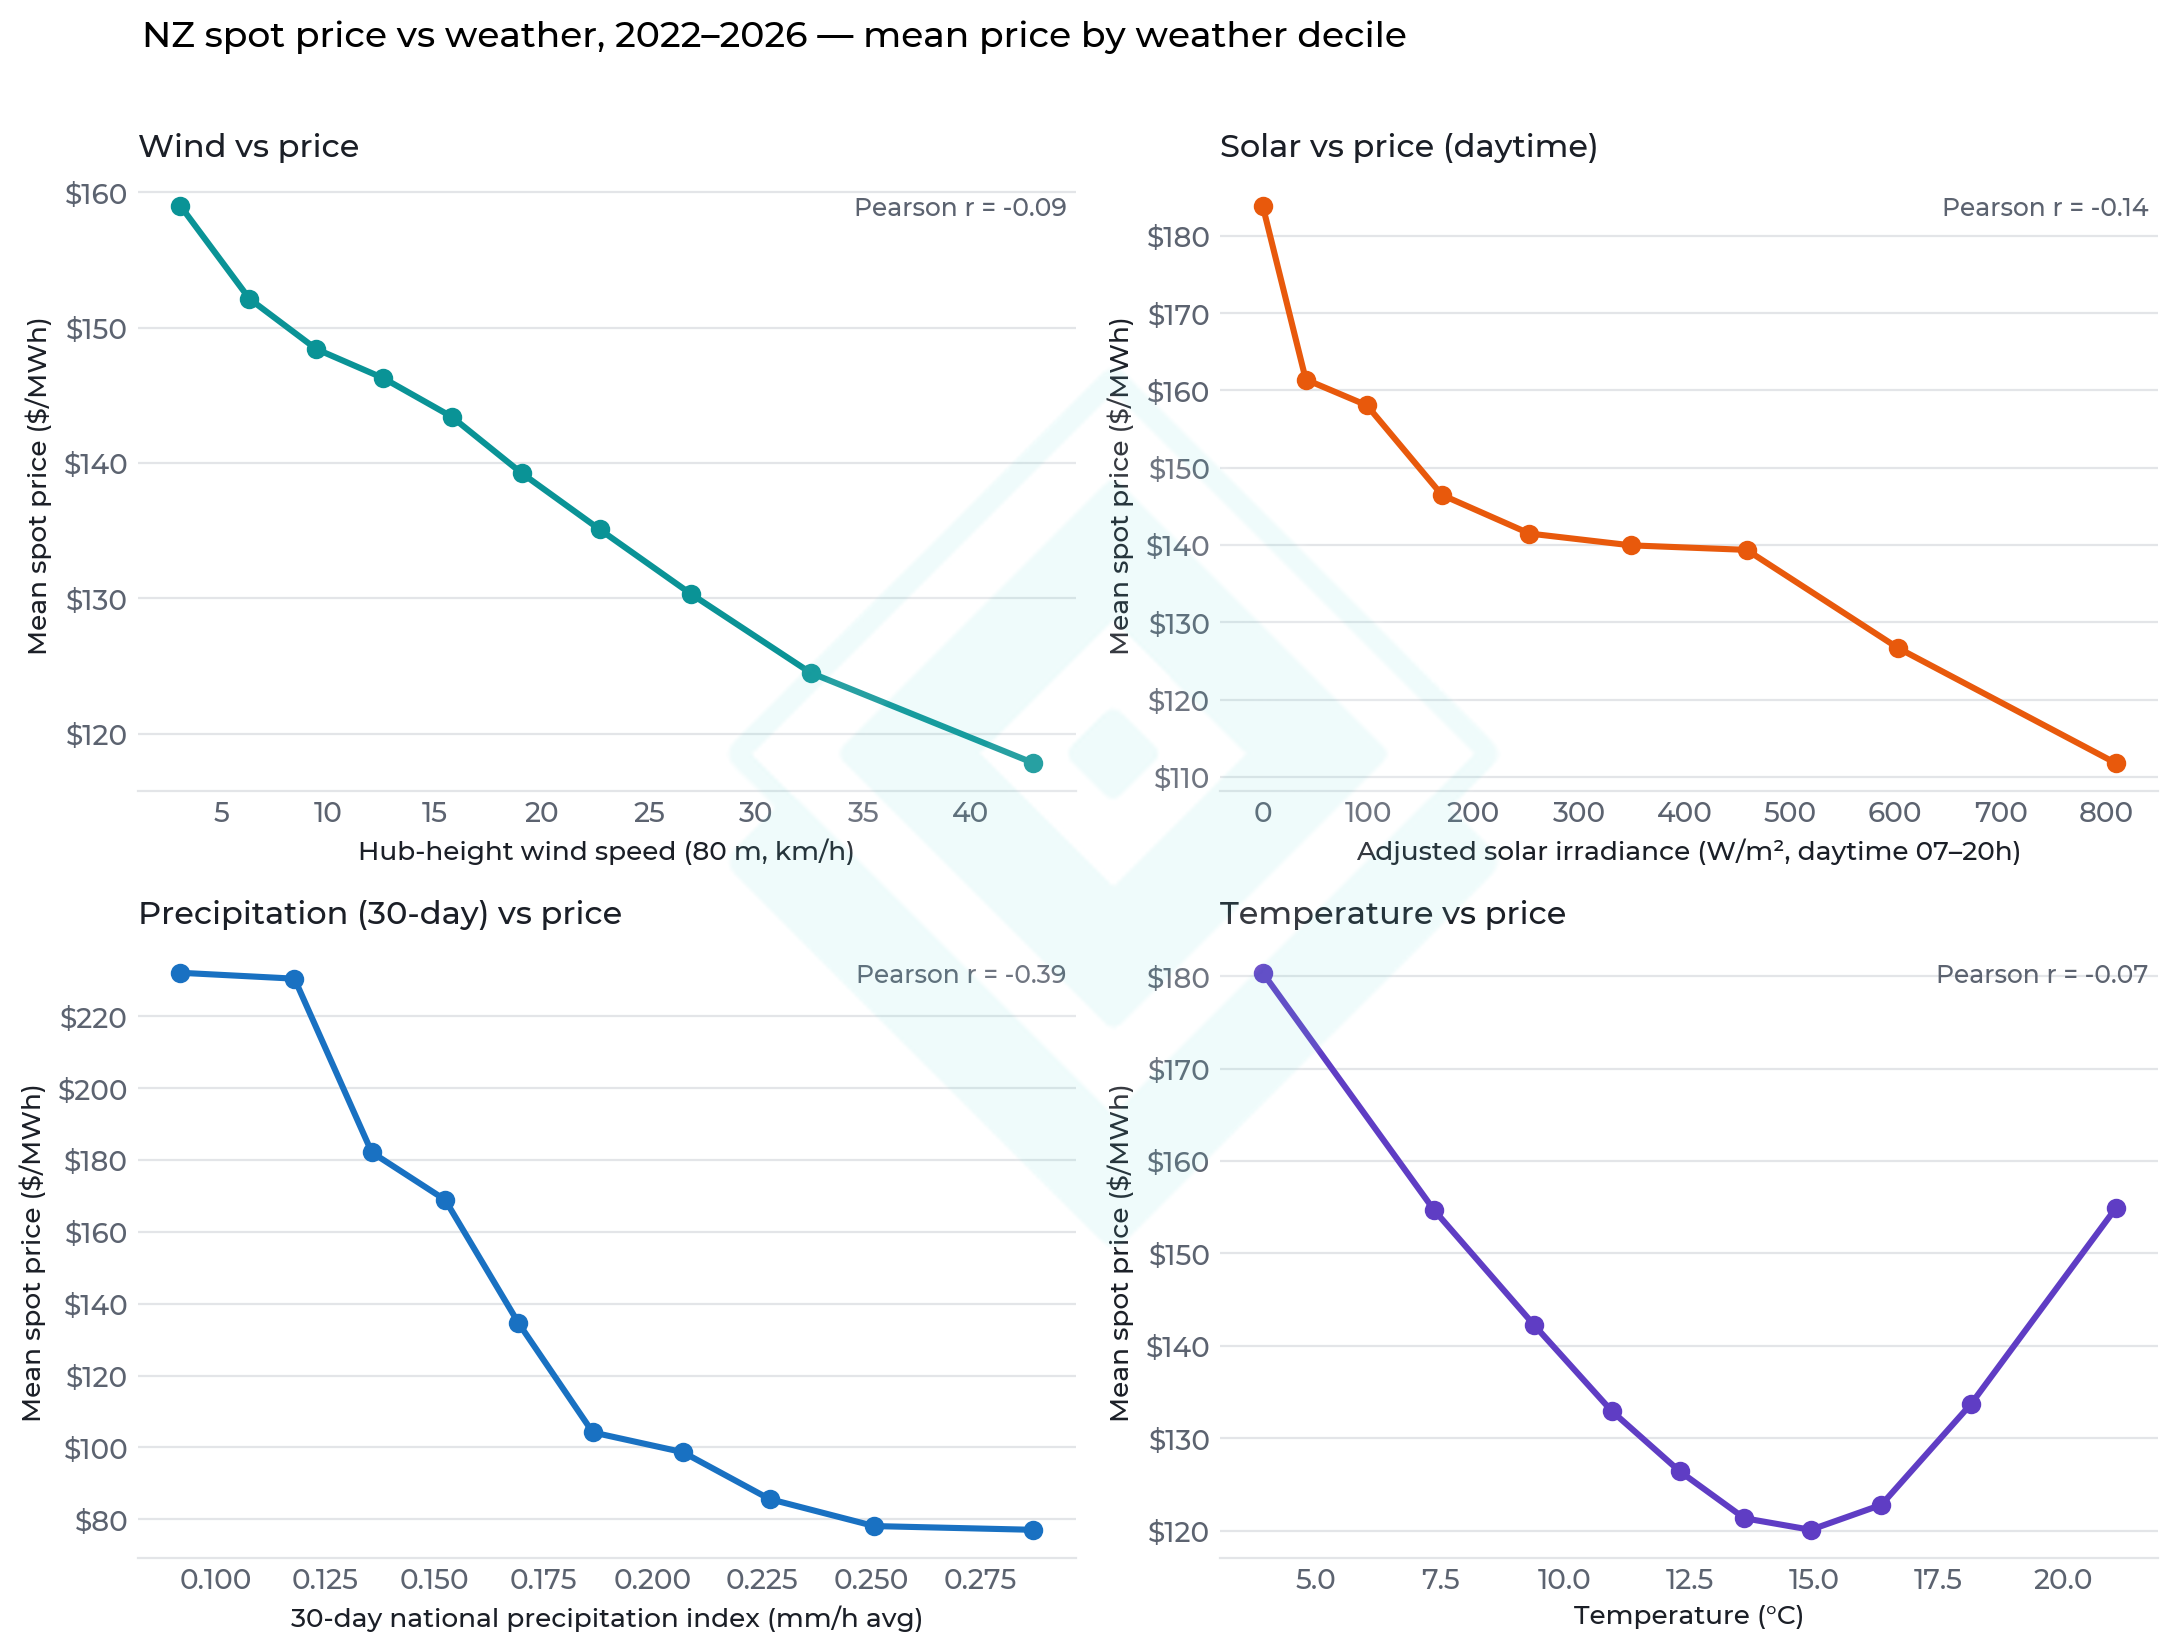
- Precipitation is the dominant driver, at the monthly timescale: moving from the driest to the wettest decile of the 30-day national precipitation index takes the mean spot price from $232/MWh to $77/MWh — a 3× swing (Pearson r = -0.39, the strongest of the four).
- Sunshine: daytime prices average $184/MWh in the darkest irradiance decile vs $112/MWh in the brightest (−39%), with the steepest drop at the low end — cloudy daytime hours are what's expensive.
- Wind: calm hours (bottom decile of 80 m hub-height wind) average $159/MWh against $118/MWh in the windiest decile (−26%), a smooth, monotonic decline.
- Temperature is U-shaped: prices bottom out near 15°C ($120/MWh) and rise toward both ends — $180/MWh below ~5°C (heating demand) and $155/MWh in the warmest decile (summer demand meeting dry-season supply).
- The most expensive 5% of hours (>$341/MWh) are a recognisable weather regime: 50% occur in winter, with below-average wind (17.0 vs 19.4 km/h), below-average sunshine, cold (10.9°C) and a dry preceding month (0.146 vs 0.236 mm/h in the cheapest hours).
Four Variables, Four Shapes
Each panel bins all matched hours into deciles of the weather variable and plots the mean spot price per decile — a shape-revealing view that makes no linearity assumption. The Pearson correlations on hourly data look modest (−0.07 to −0.39) because hourly prices are noisy; the decile means show the systematic structure underneath.
The mechanisms differ. Wind and solar displace marginal thermal and hydro generation within the hour — more of either means cheaper power, immediately. Precipitation barely matters within the hour; what matters is its accumulation into hydro storage, which is why the 30-day index carries a 3× price swing. Temperature drives demand: every degree below ~15°C adds heating load, and the warmest hours combine air-conditioning demand with the dry late-summer hydro season.
Why This Matters
Two practical implications from this analysis stand out. First, renewable capture risk in New Zealand is still mild: windy and sunny hours are cheaper, but by tens of dollars, not the negative-price regimes seen in Australia. Second, the price system's memory lives in the hydro lakes: a dry month is worth roughly +$150/MWh to the average spot price, which is why dry-year risk dominates every security-of-supply debate in this market.
Methodology
- Prices: half-hourly wholesale spot prices for all GXP offtake nodes, 2022 to July 2026, averaged to hourly; hours outside −$500 to $10,000/MWh excluded as data artefacts.
- Weather: hourly ERA5-based reanalysis for 47 NZ cities — temperature (2 m), wind speed (80 m hub height), adjusted solar irradiance, and precipitation.
- Join: each GXP matched to its nearest weather station via the platform's point-of-connection reference; prices and weather joined on local (NZT) hour, giving ~1.7 million matched observations.
- 30-day precipitation index: precipitation averaged across all stations per hour, then rolled over the trailing 30 days — a proxy for hydro catchment inflow conditions.
- Decile curves: observations binned into deciles of each weather variable (solar restricted to 07:00–20:00); the plotted point is the decile's median weather value against its mean price.
Caveats
- These are associations, not a dispatch model: weather variables are mutually correlated (cold snaps are often calm and clear; wet months are windy), so single-variable curves overlap in what they explain.
- City weather stations proxy demand-weighted weather well but under-represent hydro catchments; the precipitation index is a national average, not inflow-weighted.
- The window (2022–2026) includes two dry episodes (2024, autumn 2025); shapes are stable across the window but the price levels reflect this period's thermal fuel costs.