
Executive Summary
New Zealand's hydro-dominated power system needs a store of standby energy for dry years — historically supplied by Taranaki gas and Huntly coal. With indigenous gas production now declining steeply, the government has accepted a case for LNG import procurement while the major generators argue electricity security is manageable without it. This report tests the question against the data: we build the dry-year 'coverage stack' — domestic gas left over for electricity, the authorised Huntly coal reserve, and Tiwai smelter demand response — and compare it year by year with what a 1-in-10 dry year actually requires.
That requirement is not a fixed number. Thermal fuel burned for electricity has been falling for two decades as geothermal and wind displaced baseload gas, so we measure the dry-year need against the trend: thermal fuel use (gas plus Huntly coal) has declined by 2.7 PJ per year since 2000, and in the worst dry years it has peaked about 20–24% above that trend. Extrapolating both gives a P90 dry-year requirement of ~48 PJ in 2026, falling to ~35 PJ by 2030 and ~19 PJ by 2035 if the renewables-driven decline continues.
The answer depends on which question is being asked. For electricity dry-year risk, the toolkit covers the requirement in most years, with modest and closable shortfalls in the pinch period 2027–2032. For the broader gas system (industrial heat, feedstock, peaking fuel), domestic supply falls below demand around 2028–2029 regardless; the realistic responses there are importing gas as LNG, importing more coal through Huntly, or reducing gas demand outright through electrification and fuel-switching — only the first requires a new import terminal.
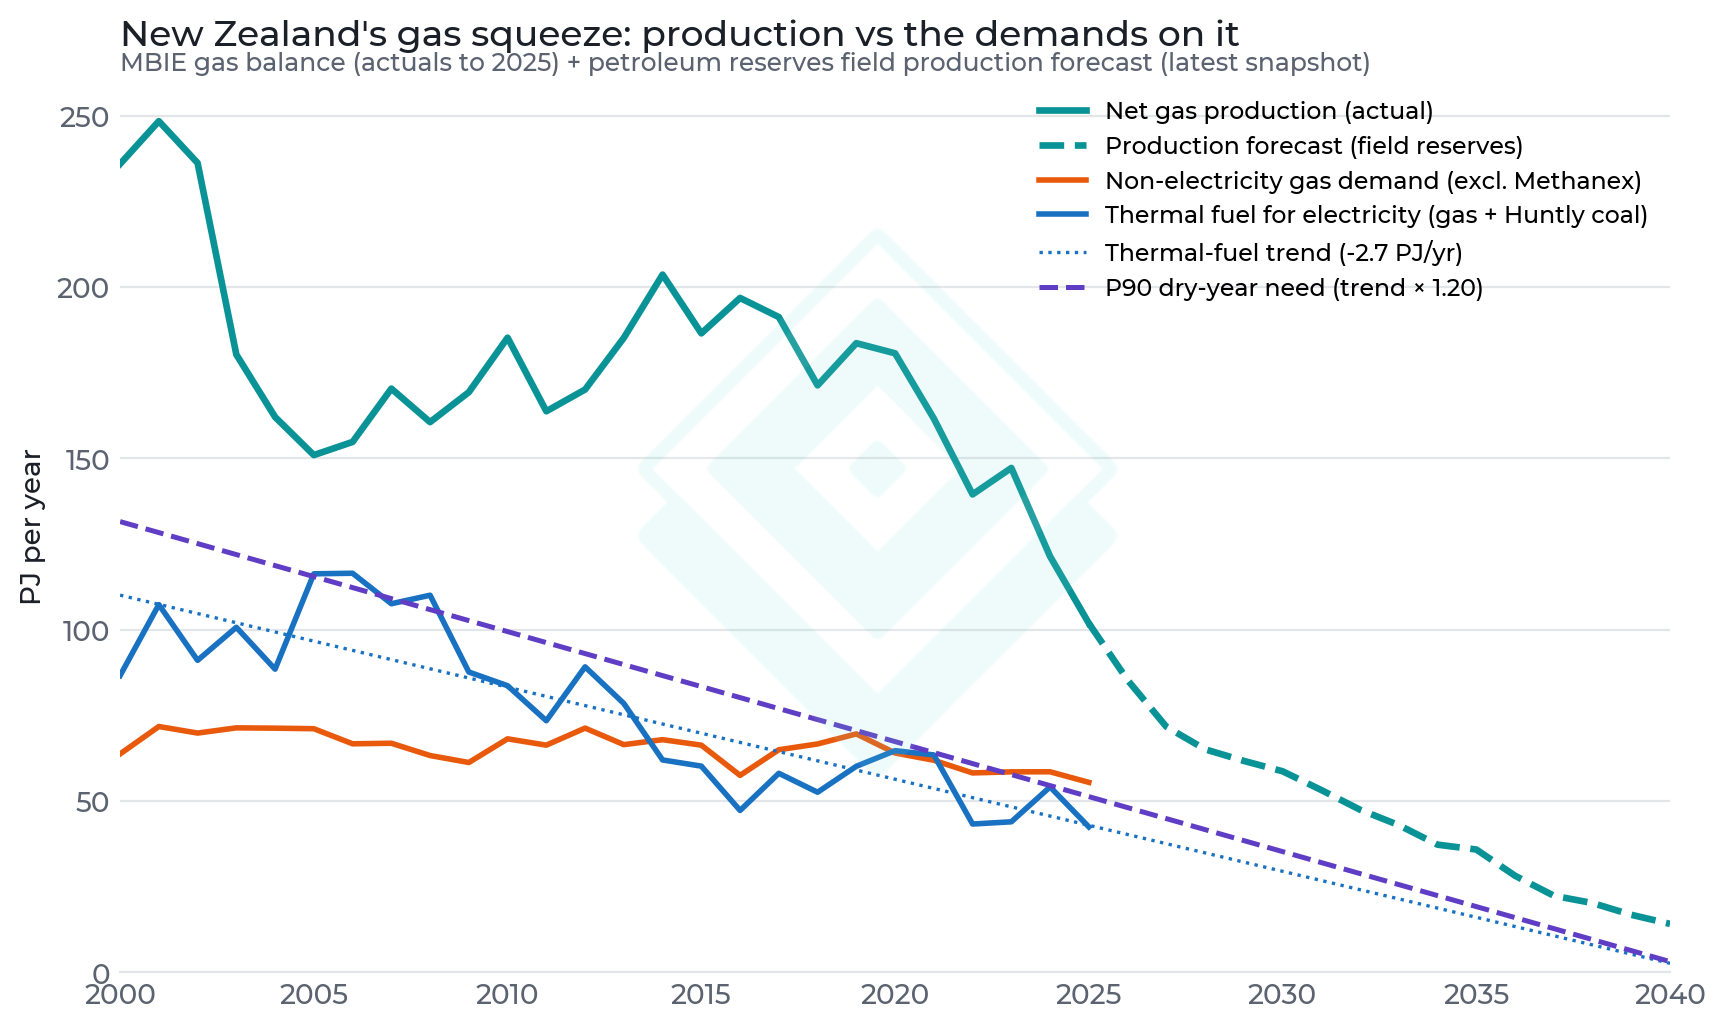
- Domestic gas production has halved in a decade: 101.9 PJ in 2025, forecast 65.1 PJ by 2028 and 58.7 PJ by 2030 on current field reserves — below the ~55 PJ that non-electricity users (excluding Methanex) consume today.
- The dry-year requirement is falling fast: thermal fuel for electricity peaked above 100 PJ in the 2000s dry years but was 42 PJ in 2025; on trend, a 1-in-10 dry year needs ~48 PJ in 2026 and ~35 PJ by 2030 (trend × 1.20 dry-year exceedance, worst observed ×1.24 in 2008).
- Against that requirement the coverage stack (56 PJ in 2026, 30 PJ in 2030) covers 2025–2026, runs 6 PJ or less short through the 2027–2032 pinch, and covers again from 2033 — provided the Huntly Strategic Energy Reserve (Rankine units plus a ~1.1 Mt / ~24 PJ coal stockpile, authorised to 2035) stays in place. From 2031 that stockpile is essentially the whole stack.
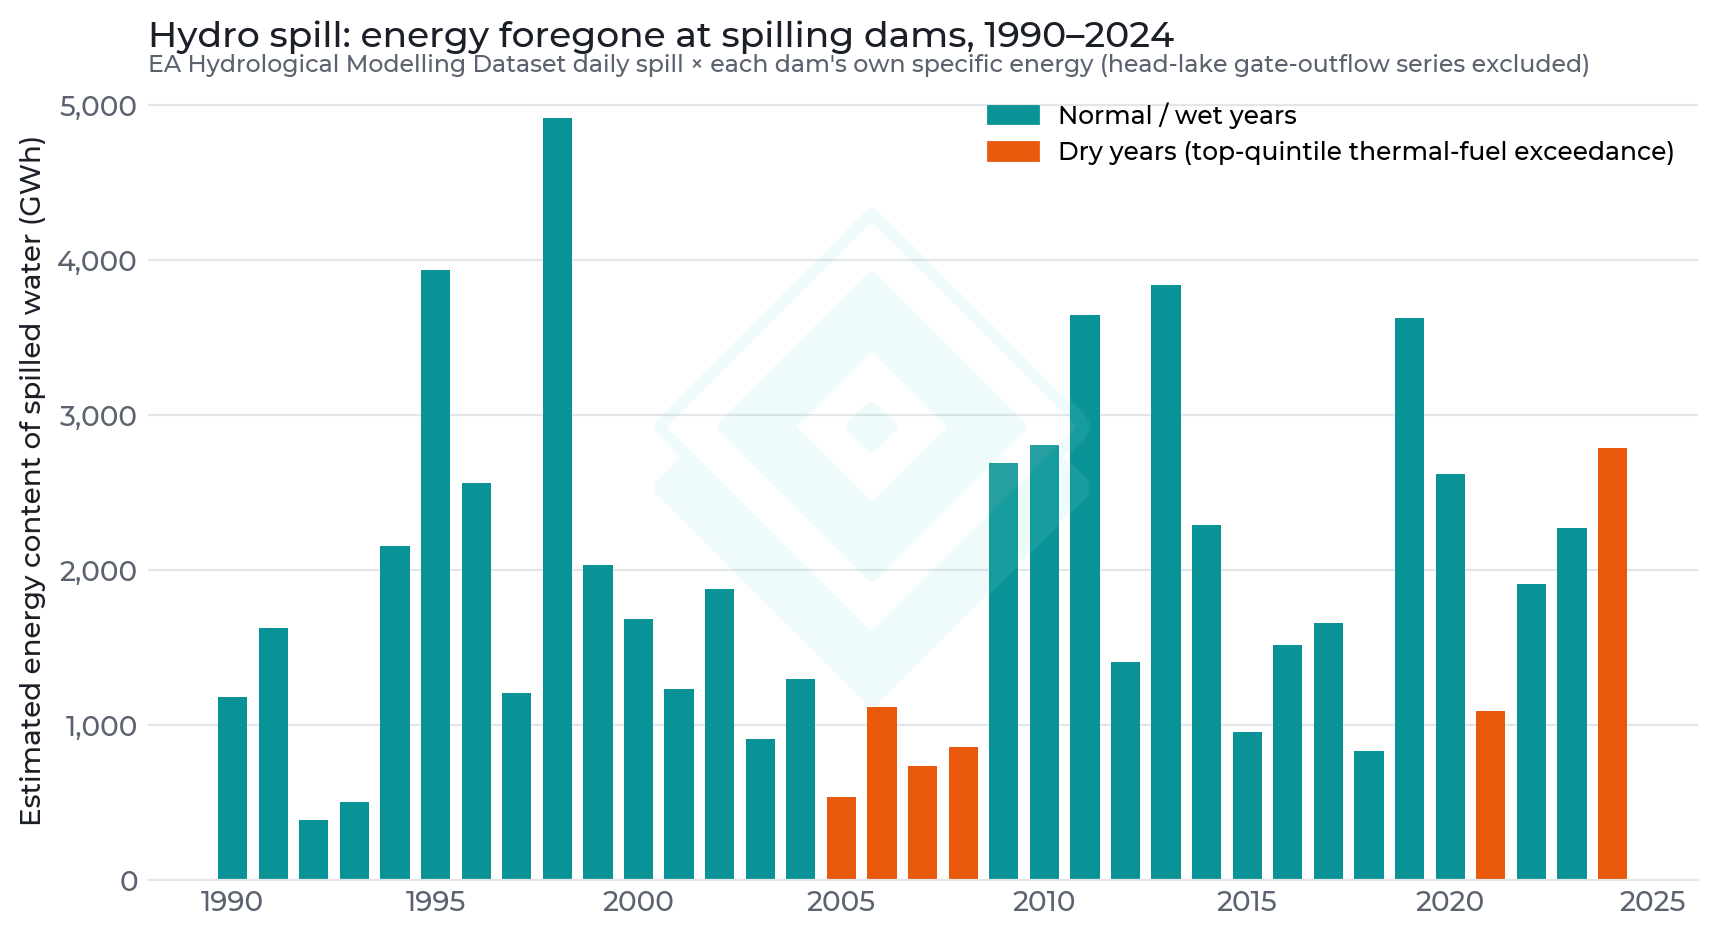
- Batteries displacing hydro spill is not a dry-year rescue: spilled water carried an estimated ~1,908 GWh/yr of energy on average over 1990–2024 (~15 PJ gas-equivalent), and ~1,189 GWh (~10 PJ) even in dry years — but much of it is flood spill beyond turbine capacity, which batteries cannot recover.
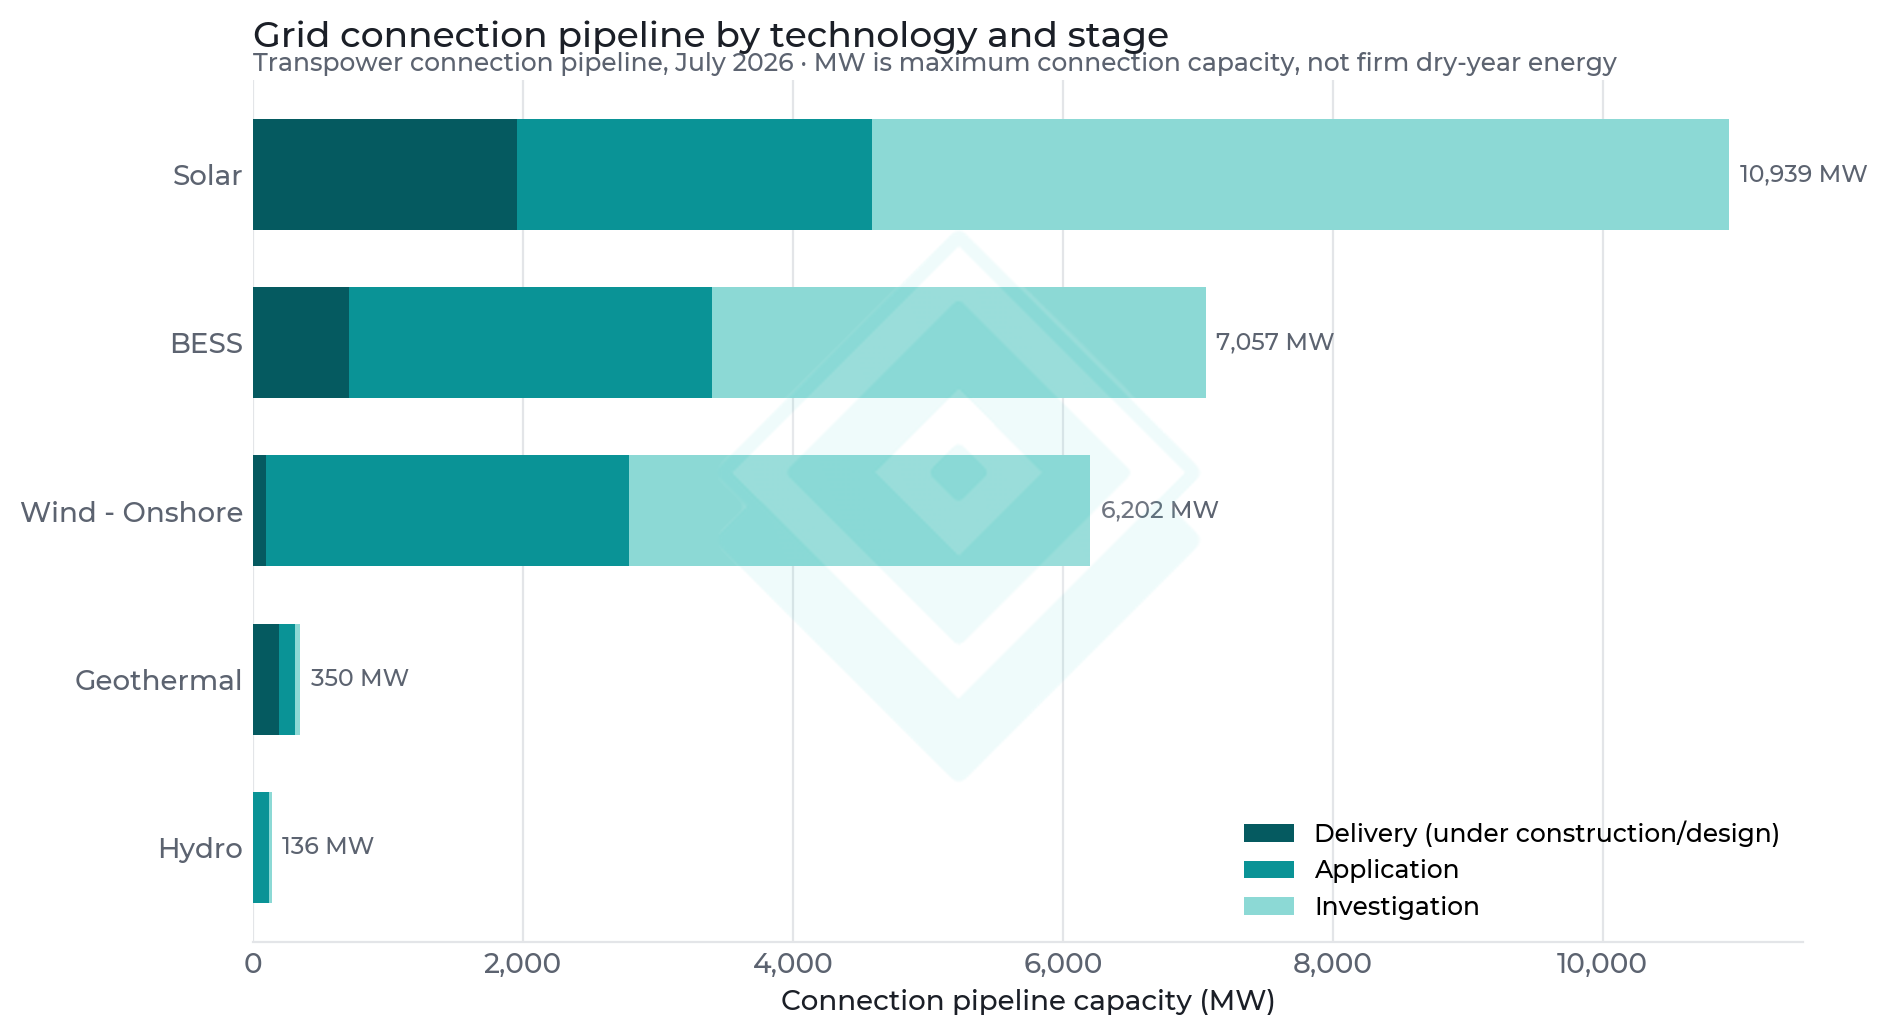
- Renewables are arriving at scale — 10,939 MW of solar, 7,057 MW of batteries and 6,202 MW of wind in the Transpower connection pipeline — and every GWh of firm winter output pushes the dry-year requirement down the trend line faster.
- Bottom line: the electricity-only case for an LNG terminal is weak through ~2030 provided the Huntly coal reserve stays available and renewable build continues.
The Gas Squeeze — and the Shrinking Dry-Year Problem
Net gas production peaked above 200 PJ in the mid-2010s and has fallen to 101.9 PJ (2025); the field-level reserves forecast has it passing 65.1 PJ in 2028 and 35.8 PJ by 2035. Non-electricity demand excluding Methanex — industrial process heat, cogeneration, commercial and residential users — has been far stickier, at ~55 PJ. The gap between those lines is what remains for electricity generation.
But electricity's need for that gas has been shrinking just as steadily. Thermal fuel burned for power (gas plus Huntly coal) has fallen ~2.7 PJ per year for 25 years as geothermal, wind and now solar displaced it. Dry years interrupt the decline — they don't reverse it: each dry-year spike (2005–2008, 2021, 2024) peaks roughly 20–24% above wherever the trend is at the time, then the decline resumes. The dashed requirement line in Figure 1 extrapolates exactly that: the trend times the 90th-percentile dry-year exceedance.
In wet and normal years the market self-balances through prices — Methanex and industrial users curtail first, as they did repeatedly in 2023–2025. The binding constraint is the 1-in-10 dry hydro year, and it is that requirement the rest of this report tests.
The Dry-Year Coverage Test
The stack combines the three non-LNG tools available in a declared dry year: domestic gas left after non-electricity users (with Methanex curtailed, as its contracts and behaviour already allow), Huntly coal bounded by the authorised Strategic Energy Reserve stockpile, and the formalised Tiwai Point demand-response contracts (~330 GWh ≈ 2.6 PJ gas-equivalent, exercised in 2024 and 2025).
Read against the trend-based requirement, the picture is a pinch, not a cliff. In 2025 and 2026 the stack (~73 and ~56 PJ) covers the requirement. From 2027 to 2032, domestic gas exits faster than the requirement falls and the toolkit runs short by roughly 2–6 PJ a year; from 2033 the requirement's continued decline toward ~19 PJ brings it back under the ~27 PJ that coal and Tiwai provide. Shortfalls of that size are the scale of an enlarged coal stockpile, a second Tiwai-style demand-response tranche, or one additional wind farm's winter output — not the scale of an LNG import terminal (the GIC's modelled minimum is 12 PJ/yr).
Huntly carries the result: from 2031 the stockpile is essentially the entire stack, and when the Strategic Energy Reserve lapses after 2035 that support ends — manageable if the requirement has continued down its trend, exposed if it hasn't. A P90 year is a ~10% annual draw; through the pinch period a bad-but-not-extreme year is manageable with coal, demand response and conservation, while a severe year would mean sustained scarcity pricing and industrial curtailment beyond Tiwai.
What the Renewables Pipeline Does — and Doesn't — Fix
The requirement line falling is not automatic — it is the accumulated effect of commissioning. The connection pipeline is dominated by solar (10,939 MW, of which 1,952 MW already in delivery) and batteries (7,057 MW), which erode the dry-year requirement only slowly: solar output is weakest exactly when dry-year stress peaks (winter), and batteries shift energy within a day, not between seasons. Wind (6,202 MW in the pipeline, but only 93 MW in delivery) and geothermal (350 MW, 190 MW in delivery) do the heavy lifting on winter energy; their commissioning pace decides whether the requirement keeps falling along the trend line.
There is also an indirect channel from distributed solar and batteries to dry-year security: midday solar (stored or consumed) lets hydro hold water back, effectively converting reservoir storage into dry-year insurance. Our previous modelling of that channel at Australian-style uptake rates is worth roughly 4–6 PJ by 2030 — already implicit in the declining trend if uptake continues.
Batteries and Spilled Water
Another scenario analysed is the ability for grid-scale batteries to ease dry-year risk by reducing hydro spill. The Electricity Authority's hydrological dataset lets us size that prize. Valuing each dam's recorded daily spill at that station's own energy conversion (spilled water rejoins the river and is reused downstream, so only the spilling station's generation is lost), spill carried an average of ~1,908 GWh per year over 1990–2024 — roughly 15 PJ of gas-equivalent — ranging from ~388 GWh in the driest-inflow years to ~4,921 GWh in flood years like 1998.
Even in the dry years that define our requirement line, spill averaged ~1,189 GWh (~10 PJ gas-equivalent) — 2024 being the clearest example of a dry year punctuated by flood events. That is a materially large number against a 2–6 PJ coverage gap. The catch is what spill physically is: most of it occurs when river flows exceed turbine capacity during floods, and no amount of battery charging changes what a turbine can swallow. Batteries address the other component — operational spill, where stations back off because demand or prices are low (increasingly, sunny middays) while lakes are full. Our dataset does not separate the two, so the honest statement is a bound: batteries can recover some fraction of a ~10 PJ dry-year resource, and quantifying that fraction — via flood-day decomposition of the spill record — would be a natural extension of this analysis.
The Decision
Framed as 'should NZ invest in an LNG terminal for dry-year electricity risk', the data supports a conditional no: the authorised Huntly coal reserve plus Tiwai demand response covers the trend-based requirement in most years, the 2027–2032 shortfalls are single-digit PJ — closable with an enlarged stockpile, additional demand response, or one to two years' normal renewable commissioning running ahead of trend — and coal stockpiles (unlike gas fields) can be replenished by sea. An LNG terminal built for electricity alone would be an expensive insurance against the coincidence of a severe drought, a stalled generation build, and a Huntly outage, purchased at high fixed cost and 2–4 years of lead time.
The LNG terminal question is really a question about the future of New Zealand's gas-consuming industry, and should be argued on that ground. The burden of paying for new gas infrastructure should not fall on the electricity industry or electricity consumers.
Methodology
- Gas supply and demand: MBIE gas balance (annual, PJ), actuals 2000–2025; sector split from the same source. Forward production: MBIE petroleum reserves field-level production profiles, latest snapshot, pre-aggregated 'Total' rows excluded.
- Dry-year requirement: thermal fuel for electricity = gas for electricity generation (MBIE gas balance) plus Huntly coal fuel (coal generation GWh at an assumed 33% thermal efficiency). A linear trend is fitted over 2000–2025 (-2.7 PJ/yr); each year's actual is expressed as a ratio to trend; the P90 of those ratios (1.20; maximum 1.24 in 2008) is applied to the extrapolated trend to give the P90 dry-year requirement. Thermal fuel (not gas alone) is used because constrained gas supply pushed recent dry-year strain onto coal, which a gas-only series would miss.
- Coverage stack: domestic gas available = forward production minus non-electricity demand excluding Methanex (held at 2025's ~55 PJ; Methanex assumed curtailed in a declared dry year, consistent with 2023–2025 behaviour and the GIC's assumed 2027 exit). Huntly coal = Strategic Energy Reserve stockpile bound (~1.1 Mt ≈ 24 PJ thermal; SER authorised to 31 Dec 2035); maximum observed modern-fleet burn is ~33 PJ fuel-equivalent (2021). Tiwai demand response = 2.6 PJ gas-equivalent (~330 GWh, per 2024–25 exercised contracts).
- Hydro spill: EA Hydrological Modelling Dataset (20241231 snapshot) daily spill series for 23 dams, 1990–2024. Energy = spill volume × the spilling station's specific energy derived from its disclosed plant factor (cumecs/MW); spilled water rejoins the cascade, so only the bypassed station's generation is counted, avoiding double-counting. Head-lake gate-outflow series (Taupo, Hawea, Te Anau) are total outflow, not lost spill, and are excluded. Gas-equivalents assume 45% thermal efficiency.
- Renewables: connection pipeline from Transpower connection project data (July 2026), maximum MW by technology and process stage.
- External anchors: GIC Gas Supply & Demand Study 2026 (gas-system crossover ~2028–2029, minimum 12 PJ/yr LNG); Transpower SOSA 2025; Commerce Commission SER authorisation (Nov 2025).
Caveats
- The requirement line is a linear extrapolation of a 25-year decline. It embeds continued renewable commissioning at roughly the historical pace, and the final petajoules of thermal displacement (winter peaks, calm weeks) are the hardest — the true path likely flattens somewhere above zero rather than reaching it in 2040.
- Dry-year exceedance ratios are drawn from six dry episodes in 25 years; the worst observed (×1.24) is not a physical upper bound.
- Non-electricity gas demand is held flat excluding Methanex; actual demand destruction is price-driven and could free more (or less) gas for electricity than assumed.
- The coal stockpile bound treats one severe dry year; consecutive dry years would require mid-crisis replenishment (imports) and are not modelled.
- The spill energy estimate cannot separate flood spill (unrecoverable — turbine capacity is the constraint) from operational spill (the battery-addressable component); the figures given are the total resource, an upper bound on what storage could recover.
- Field-reserves production forecasts have historically revised in both directions; new discoveries or field investment could lift the gas line.
- Thermal efficiencies (33% Huntly Rankine coal; 45% gas-fleet blend for gas-equivalent conversions) were checked against the measured record: gas-fired generation divided by gas consumed for electricity generation (MBIE, 2010–2025) implies a fleet efficiency of roughly 42–50%, bracketing the 45% used. The headline dry-year requirement uses measured fuel PJ directly and is insensitive to ±5 percentage points on either efficiency.
- This analysis takes no position on emissions policy. Medium-term, the coal backstop is the highest-emissions option in the stack (~2× gas per unit of electricity), but it is finite — the authorised stockpile represents roughly 2 Mt CO2 in total. New gas import infrastructure would be the larger long-term commitment: a terminal anchored on a minimum ~12 PJ/yr of take-or-pay LNG implies ~0.65 Mt CO2 per year for the life of its contracts, and would tend to lock New Zealand into higher emissions long-term than renewable build-out and electrification of gas-using processes.